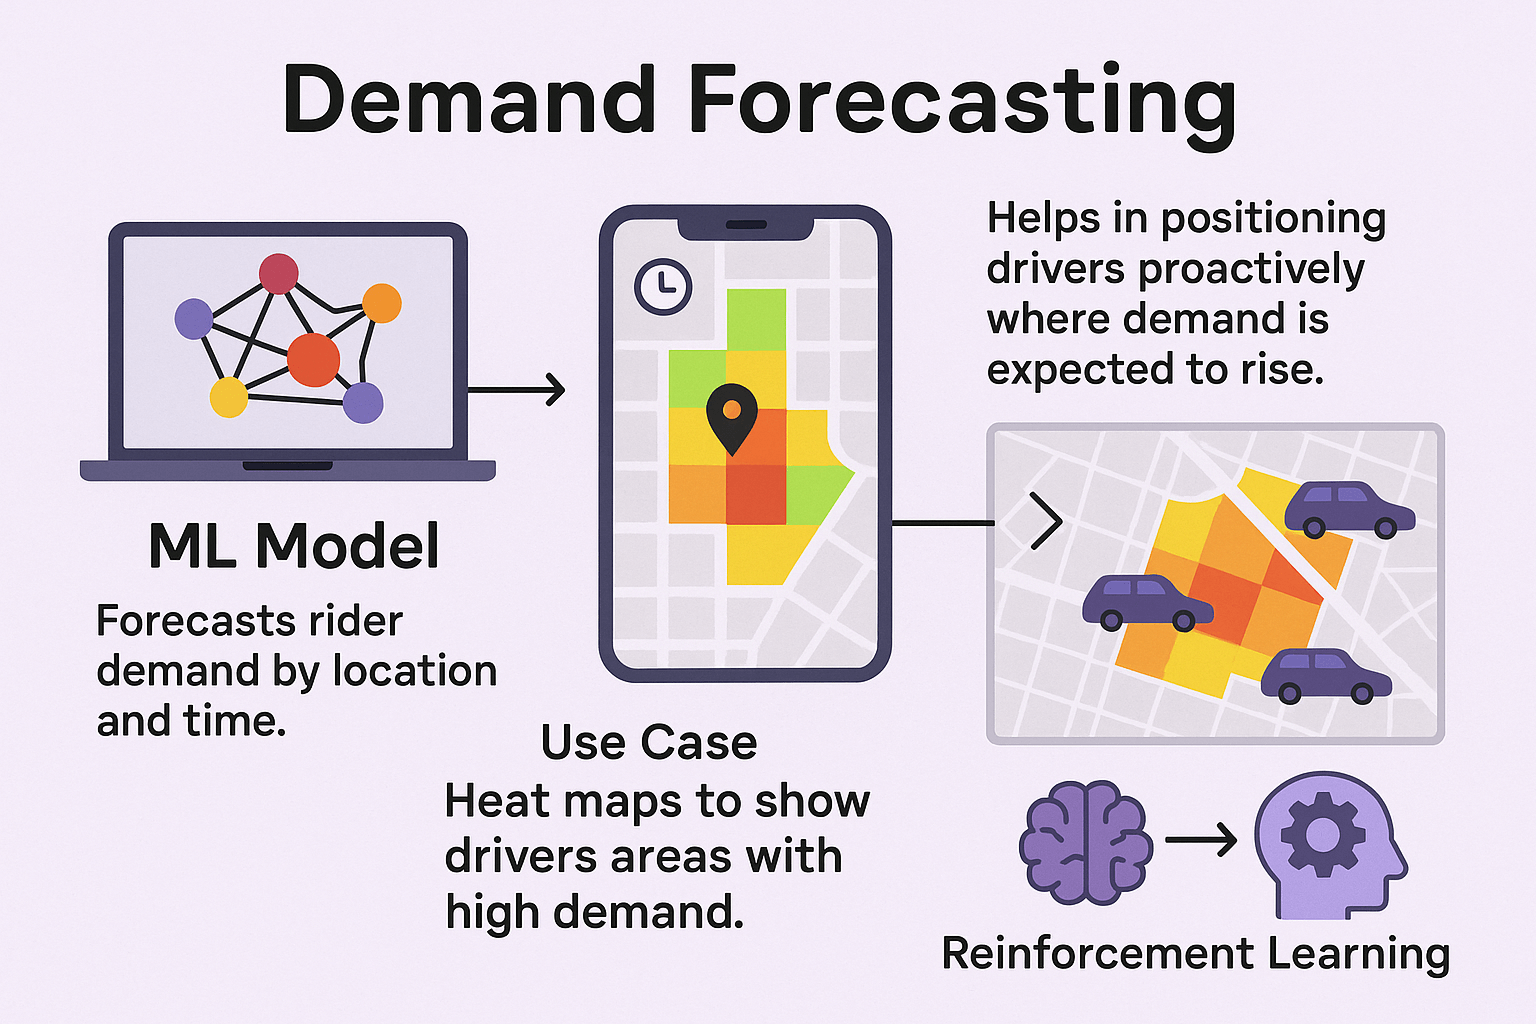
Demand Forecasting (Heat Maps)
Our AI-powered demand forecasting solution leverages cutting-edge Machine Learning and Reinforcement Learning to predict rider demand across a city—broken down into high-resolution spatial hexagons using the H3 geospatial indexing system. This enables transport and mobility companies to stay ahead of the curve and ensure supply matches demand in real-time.
How It Works
1. Data Ingestion
We gather real-time and historical data including trip logs, weather conditions, event flags, and traffic indicators.
2. ML Prediction Engine
A spatio-temporal neural network analyzes this data and predicts demand in each H3 zone at specific times.
3. RL Optimization Loop
Reinforcement Learning continually refines driver placement recommendations, learning from feedback loops and reward signals.
4. Interactive Visualization
Output is rendered as a dynamic heatmap and staging guide within your operational dashboard.
Key Features
Intelligent Heatmaps
Visualize predicted rider demand directly on an interactive map. Our system uses H3 grid cells to highlight high, medium, and low-demand zones—color-coded for quick interpretation. Hover over a cell to view detailed predictions and confidence levels.
Time-Based Forecasting
Use the time slider to view forecasted demand across different times of day. Analyze hourly or daily trends to make proactive fleet management decisions.
Reinforcement Learning-Driven Recommendations
We don't just predict demand—we learn from past decisions. Our Deep Q-Network agent provides optimal driver staging points based on real-world outcomes like reduced wait time and increased completed trips.
What You'll See
Red Zones
High anticipated rider demand — ideal for driver deployment.
Yellow Zones
Moderate demand — consider secondary staging.
Green Zones
Low demand — deprioritize or monitor.
Technical Details
Frontend Implementation
- Map Component: Uses react-h3-map to render hexagon layer.
- Controls: DateTimePicker for timestamp, Slider for time window, Dropdown for resolution.
- Data Binding: On control change, refetch /predict_demand and update heatmap layer.
ML Model Details
- Model Type: Spatio-temporal convolutional LSTM predicting count per H3 cell.
- Training Data: 6 months of ride logs, weather, events.
- Evaluation Metrics: RMSE per cell, MAE, 90% of cells within ±10 rides error.
Reinforcement Learning Integration
- Agent: Deep Q-Network recommending driver placements.
- State: current demand heatmap + driver positions.
- Action: relocate K drivers to selected H3 cells.
- Reward: negative wait time, positive completed trips.
- Loop: After each time window, rewards logged and agent retrained offline daily.
Benefits
Ideal For
Tech Stack
Backend
FastAPI (Python)
ML/AI
TensorFlow (Conv-LSTM), Custom RL with Gym
Frontend
React + H3.js for geospatial visualization
Infrastructure
Dockerized & orchestrated via Kubernetes
Implementation Timeline
Discovery & Planning
Week 1Requirements gathering and project planning
Development
Weeks 2-3Core functionality implementation
Testing & Refinement
Week 4Quality assurance and performance optimization
Deployment & Training
Week 5Deployment to production and knowledge transfer
Pricing
Fixed Project Price
Complete project implementation
Hourly Rate
For customizations & maintenance
Input Factors
- Time & Date: Analyze demand for any chosen hour or day
- Location: Forecasts made at the hexagon-level (H3 resolution 8)
- Weather & Events: Understand how external conditions impact ride requests
- Reward Signals: Learn from past deployment outcomes for improved placement